 Drone imagery / QGISPROJECT IMAGE
Working prototype
Solar Intelligence ↗
Turn drone RGB imagery into editable solar-panel polygons, counts and asset attributes inside QGIS.
DeepLabV3+ · ONNX · QGISRESEARCH, DEVELOPMENT & GIS TOOLS
Explore SpaceVexa prototypes, founder research and geospatial tools. Each entry explains its current stage.
Drone imagery / QGISPROJECT IMAGEWorking prototype
Turn drone RGB imagery into editable solar-panel polygons, counts and asset attributes inside QGIS.
DeepLabV3+ · ONNX · QGIS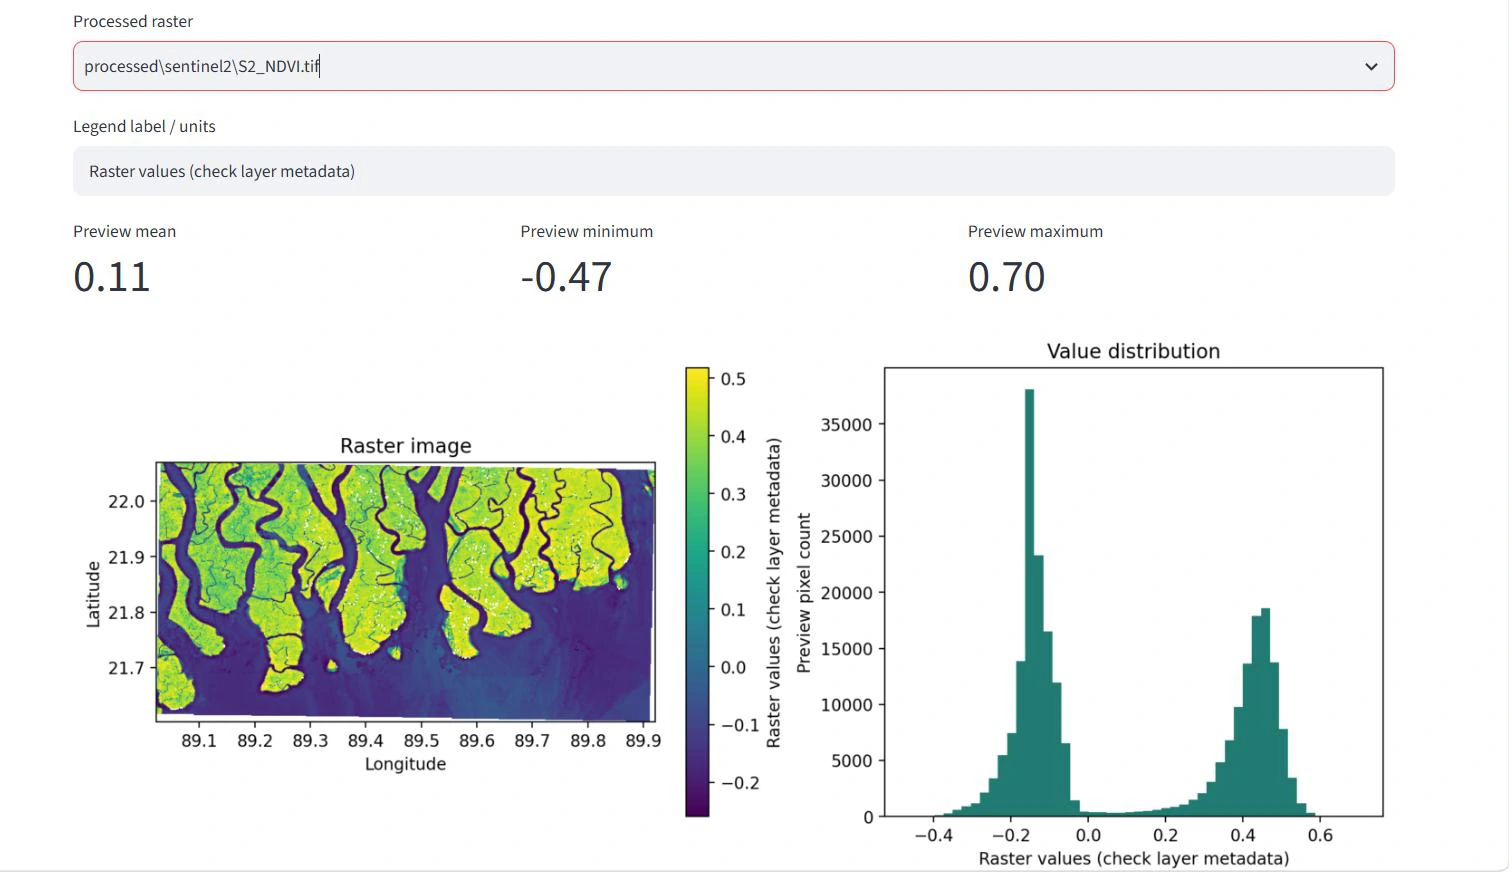 Mangrove ecosystemsPROJECT IMAGE
Research prototype
Combine GEDI observations with Sentinel-2, Sentinel-1 and ALOS-2 to explore mangrove biomass estimation.
GEDI · Sentinel-1 / Sentinel-2 · ALOS-2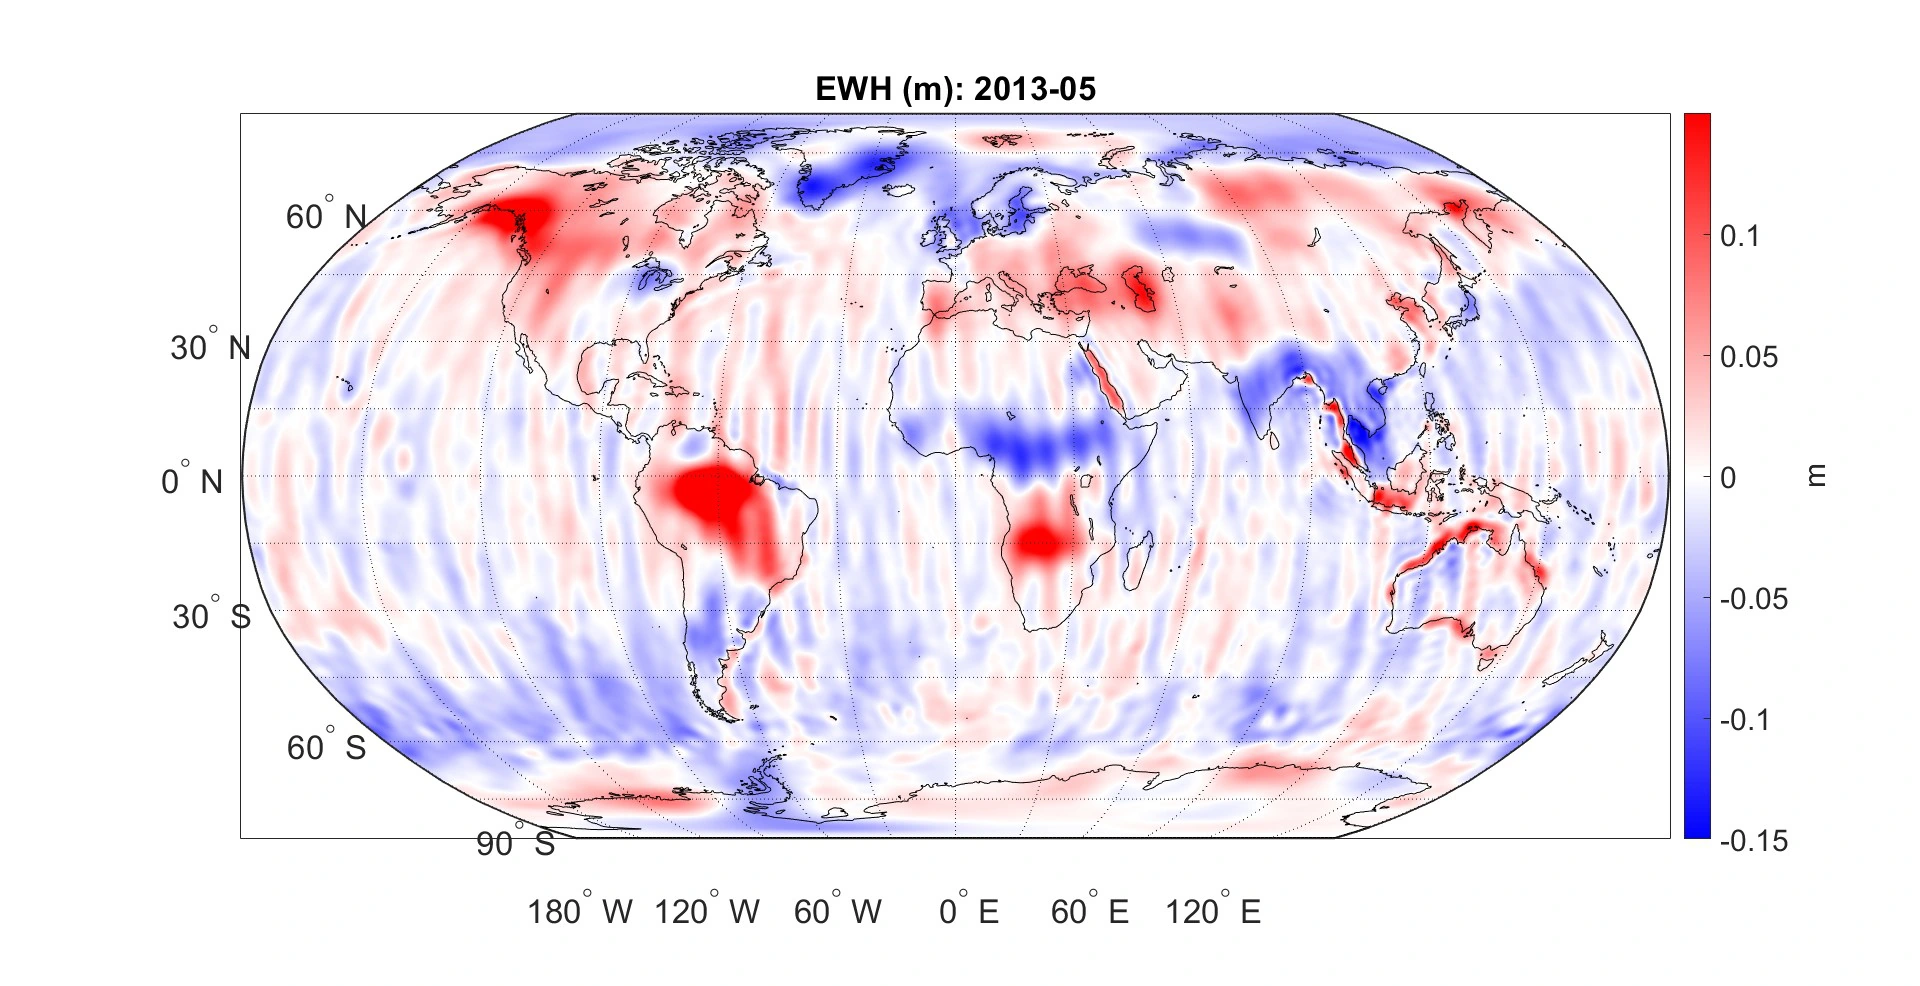 Baltic Sea / University of BonnPROJECT IMAGE
Founder’s MSc research
Investigate regional ocean-mass change in the Baltic Sea using GRACE and GRACE-FO satellite gravity observations.
GRACE / GRACE-FO · MATLAB · Geodesy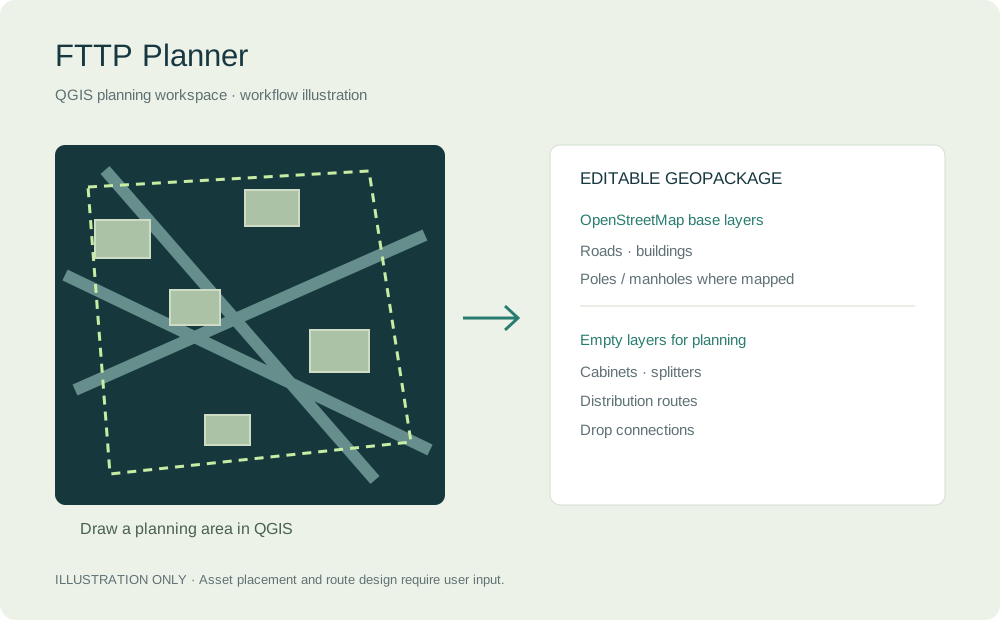 QGIS / Fibre-network planningWORKFLOW ILLUSTRATION
Experimental plugin · v0.2.1
Create an editable fibre-to-the-premises planning workspace from an area drawn in QGIS.
Python · QGIS · OpenStreetMap · GeoPackage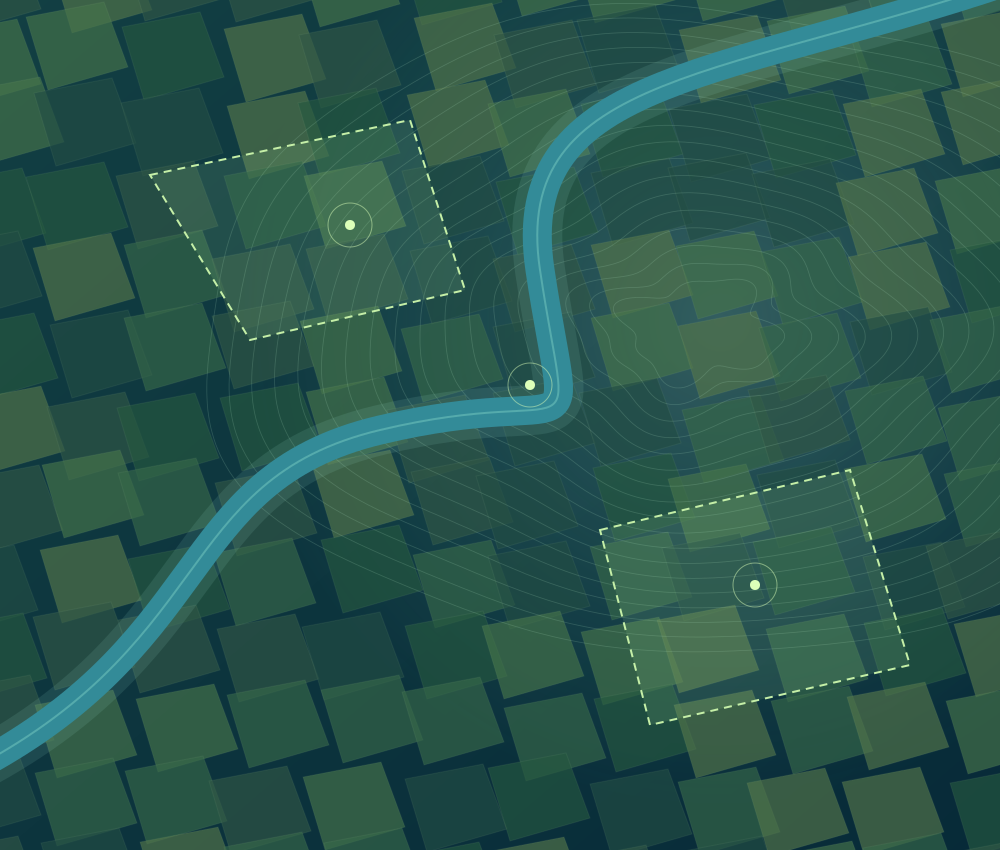 Thanjavur, IndiaCONCEPT ILLUSTRATION
Development project
Explore rice-growing conditions and seasonal vegetation patterns through satellite observations.
Sentinel-2 · NDVI / EVI / LSWI / MNDWIAhr Valley, GermanyCONCEPT ILLUSTRATIONTechnical case study
Analyse the July 2021 flood using radar observations, terrain predictors and reference mapping.
Sentinel-1 · Random Forest · CEMSDrone imagery / QGIS / Working prototype
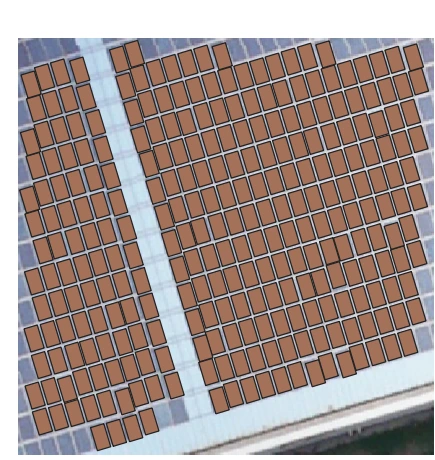
The prototype identifies solar regions, detects individual modules and refines the inventory using array geometry. Each module can carry an ID, dimensions, area, orientation and a review status. Georeferenced imagery, broader training data and independent site validation are the next steps before production deployment.
DeepLabV3+ · ONNX · QGIS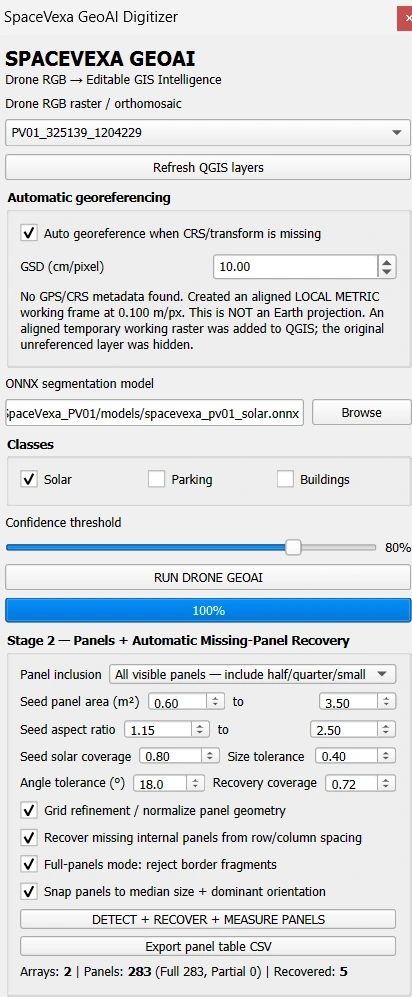
Mangrove ecosystems / Research prototype
The workflow draws or uploads an area, processes satellite predictors, filters GEDI observations and compares three Random Forest sensor combinations using common samples and spatial folds. The supplied report records 787 complete samples and a best spatial R² of 0.228. The estimates remain experimental and need independent field validation before formal carbon reporting. Carbon density is treated as a proxy using AGBD × 0.47.
GEDI · Sentinel-1 / Sentinel-2 · ALOS-2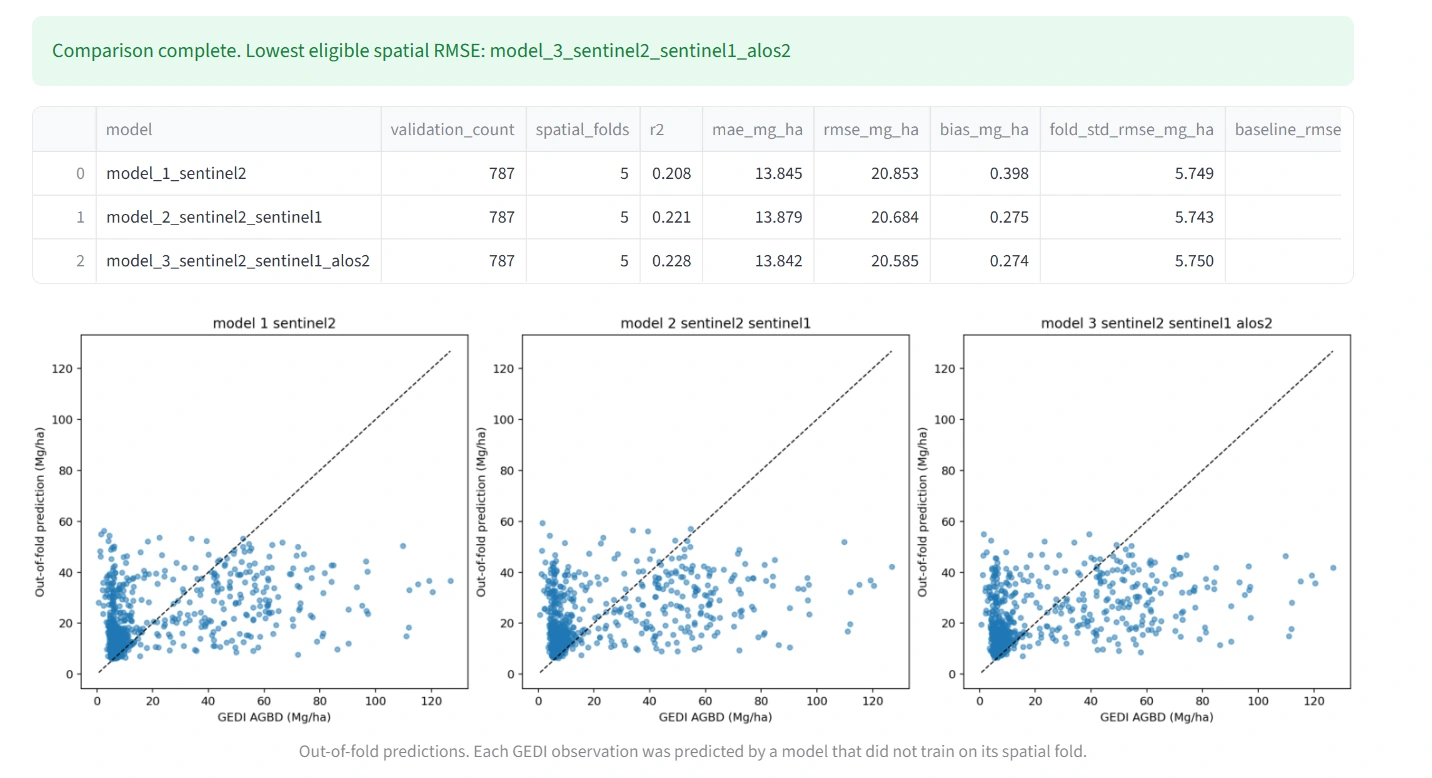
Baltic Sea / University of Bonn / Founder’s MSc research
Master’s thesis: Investigating Regional Ocean Mass Changes within Semi-Enclosed Seas Using Satellite Gravimetry. The analysis processes gravity-field solutions, examines filtering and leakage effects, and compares Baltic Sea variability with independent observations and model outputs. The global map illustrates a processing result; the Baltic Sea time series below shows the regional research focus.
GRACE / GRACE-FO · MATLAB · Geodesy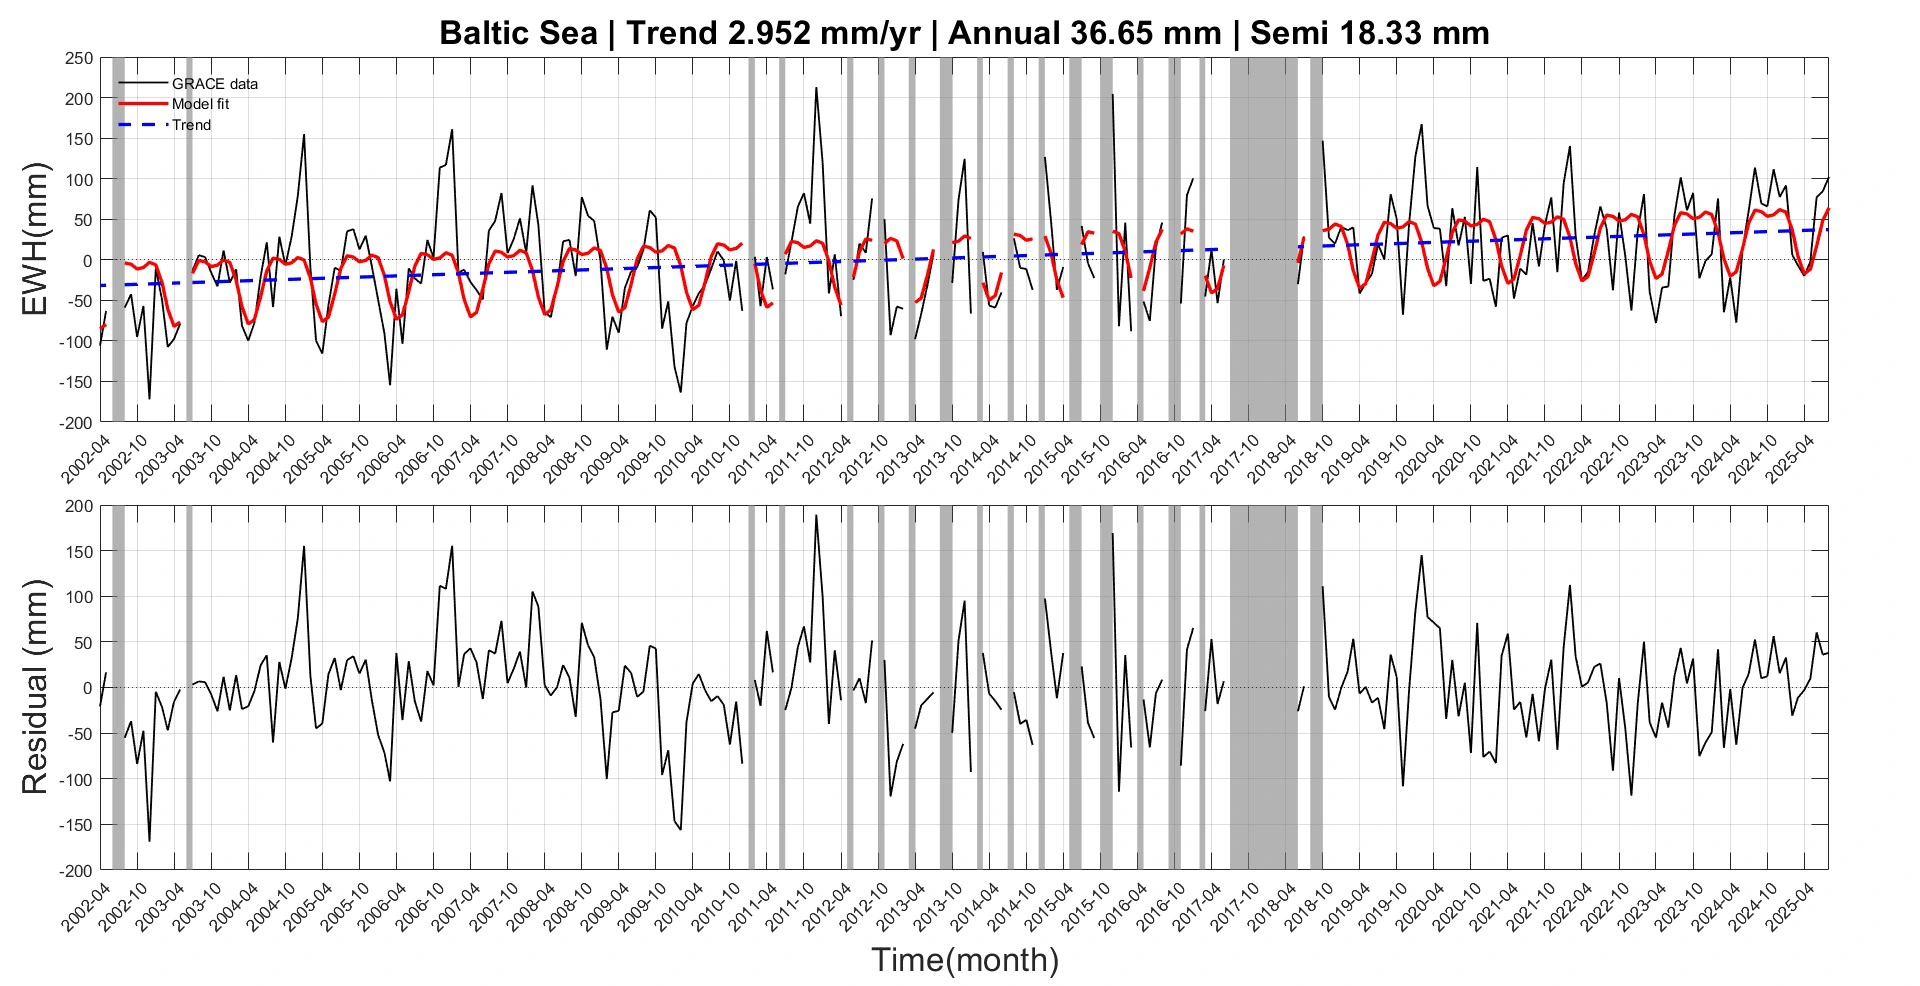
QGIS / Fibre-network planning / Experimental plugin · v0.2.1
Developed by Mani, FTTP Planner v0.2.1 lets a user draw a planning-area polygon and create a GeoPackage workspace. It downloads roads, buildings and utility poles or manholes where mapped in OpenStreetMap, clips the data to the area, and adds empty editable layers for cabinets, splitters, distribution routes and drop connections. It is a workspace-creation prototype. Asset placement and route design remain manual or use separate QGIS tools; the plugin does not automatically optimise a complete FTTP network.
Python · QGIS · OpenStreetMap · GeoPackageThanjavur, India / Development project
Cloud-masked Sentinel-2 composites support vegetation and moisture-index analysis through time. These outputs describe observed conditions; they are not direct measurements of yield. A verified project screenshot can replace the concept illustration.
Sentinel-2 · NDVI / EVI / LSWI / MNDWIAhr Valley, Germany / Technical case study
The workflow combines before-and-after radar observations with terrain and water-occurrence predictors. CEMS mapping supports reference labels and validation. A verified output map can replace this concept illustration once the original image is supplied.
Sentinel-1 · Random Forest · CEMS